
Written about 12:00 PM ET Wednesday, Nov. 11, 2026. All times Eastern. Metal prices are front-month futures, and ETF and stock prices are trades as of about 11:45 AM ET. The bond market is closed for Veterans Day, so Treasury yields are Tuesday's closes.
This is our second standalone look at precious metals. In our Oct. 12 deep dive we called the short-term trend down until inflation and the Fed stopped surprising in a hawkish direction, said $4,000 was a well-defended level, and said we would rather own high-margin miners and royalty companies on dips than chase silver or palladium. Gold has since fallen to that $4,000 line, and silver is down 13% since that piece. Newmont (NEM) is up 1.9%.
Where the four metals stand
| Futures | Price (11:40 AM ET) | Today | Since Oct. 12 | 2026 so far | From 52-week high |
|---|---|---|---|---|---|
| Gold (December) | $4,006.80 | -0.6% | -4.4% | -7.7% | -28% |
| Silver (December) | $52.11 | +2.0% | -13.4% | -25.7% | -57% |
| Platinum (January) | $1,545.80 | +0.4% | -8.0% | -24.0% | -46% |
| Palladium (December) | $1,054.00 | +3.5% | -7.2% | -35.3% | -51% |
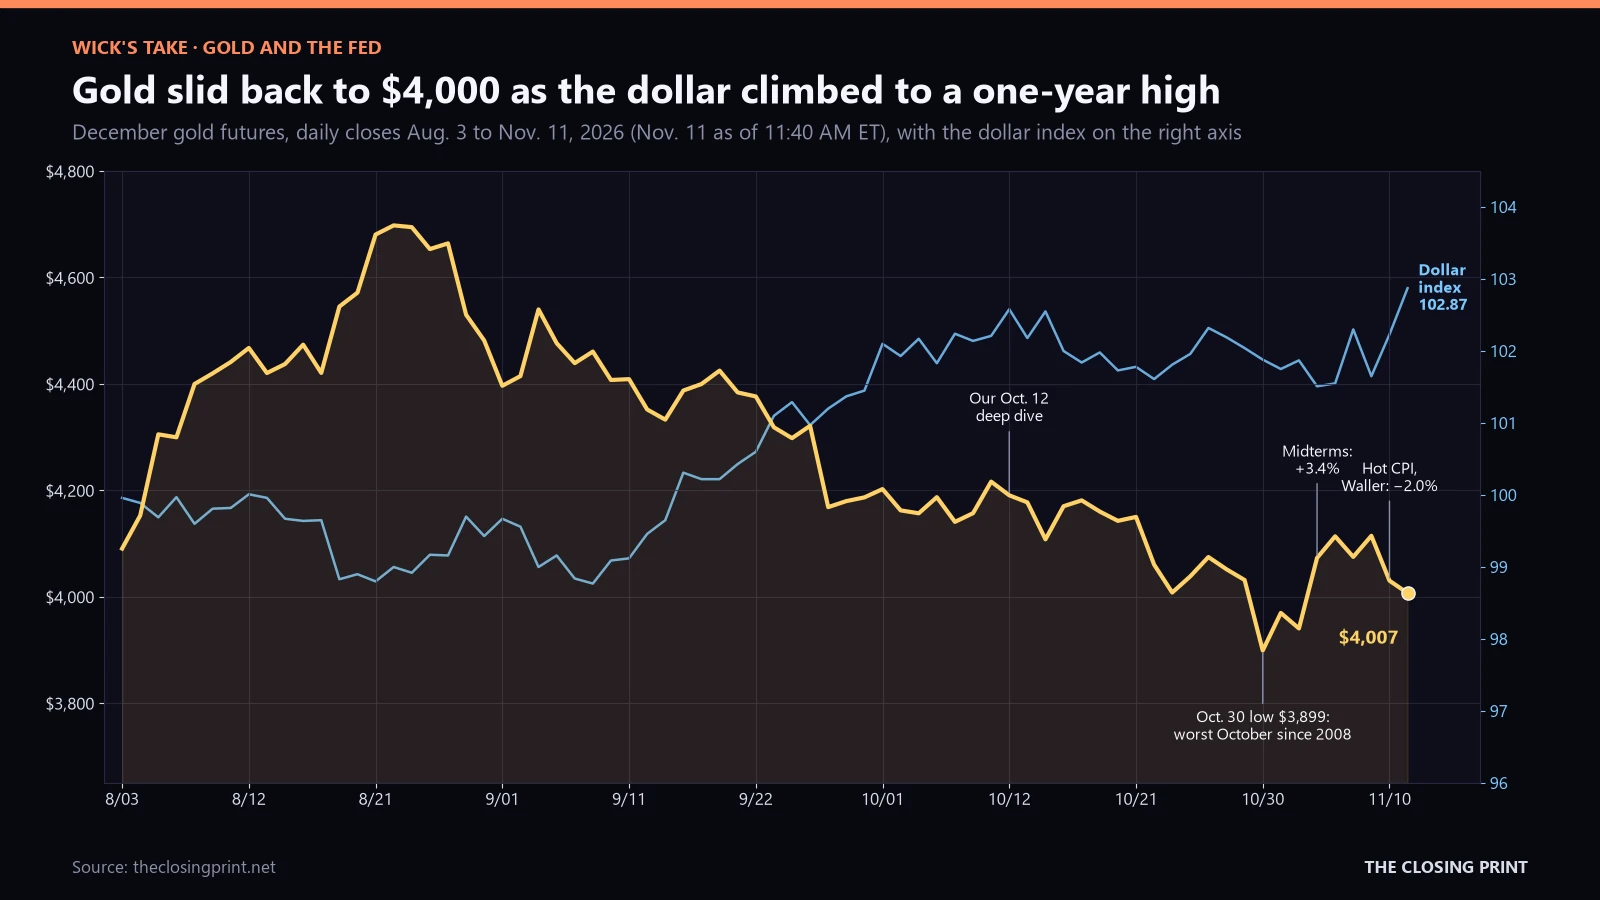
Gold peaked near $5,590 in late January, rallied to a $4,698 close in December futures on Aug. 24, and has made lower highs since. October was brutal: futures fell 6.9%, from $4,186.70 to $3,898.90, the metal's worst October since 2008. The bounce off that Oct. 30 low ran into Tuesday's inflation report. Gold jumped 3.4% on Nov. 4, the day after Democrats won control of Congress (see our midterms piece), then gave back 2.0% in futures on CPI day. Today it is holding just above the October low with the dollar pressing on it.
Silver is the only one of the four up meaningfully today, at $52.11 (+2.0%), as short sellers covered after Tuesday's 3.6% spot drop. It is still down 26% this year and about 57% below its January peak above $121. Platinum ($1,545.80) and palladium ($1,054, +3.5% today) both made 52-week lows on Nov. 3 at $1,432 and $930. They have bounced 8% and 13% since, but both remain mostly car-catalyst metals that are cheap for a reason. Palladium is down 35% this year.
What is driving gold
1. The Fed and real yields. October CPI rose 0.4% against 0.3% expected, and core rose 0.3% against 0.2%, the third straight 0.3% core print. Hours earlier, Federal Reserve Governor Christopher Waller had said a 0.3% core reading would lead him to consider a half-point hike at the Dec. 8–9 meeting. After the data, CME FedWatch fully priced a quarter-point hike from the current 3.75%–4.00% range and put about 12% odds on a half point. The 2-year Treasury yield jumped 17 basis points to 4.73% and the 10-year closed at 4.98%, as covered in our Nov. 10 Post-Market Summary. With October payrolls up 165,000 and unemployment at 4.1%, there is little in the data to talk the Fed out of tightening. The iShares TIPS Bond ETF (TIP), which falls when real yields rise, is down 4.2% this year. Higher real yields raise the cost of holding a metal that pays nothing, and that is the main reason gold is down this year. Our CPI preview flagged a hot core reading as the bigger risk, and that is what came in.
2. The dollar. The dollar index is at 102.87 today, up 0.6% and at its highest of the past year. It is up 4.7% since Dec. 31. A rising dollar makes gold more expensive for buyers outside the U.S., and the inverse relationship on the chart above has been close since September.
3. Central-bank buying: the floor. The World Gold Council estimates central banks bought 321 tonnes in the third quarter, 42% more than a year earlier and well above the five-year quarterly average of 227 tonnes. That brings the year-to-date total to 675 tonnes, 6% ahead of 2025. Only 120 tonnes of that was reported, and China (63 tonnes) and Poland (40 tonnes) made up most of the reported buying. Russia, down 19 tonnes, was the only large seller. The People's Bank of China then added another 830,000 ounces, about 25.8 tonnes, in October. That was its 24th straight monthly purchase and its largest in at least three years, bringing reserves to 78.3 million ounces, about 2,435 tonnes. China has bought more each month since March, so it buys more as the price falls. That is why we think $3,900 to $4,000 is a real support zone, not just a round number.
4. ETF flows: steady, not a stampede. Global gold ETFs took in $2.7 billion in October, their fourth straight monthly inflow, and holdings rose 19 tonnes to a record 4,275 tonnes, according to the World Gold Council. Europe (+$1.8 billion) and Asia (+$1.3 billion) did the buying. North America lost $512 million, all from U.S.-listed funds, as some investors sold gold to raise cash during the tech selloff. ETFs have added $41 billion this year. Retail demand is weaker: third-quarter bar and coin demand fell 19% and jewelry fell 17%, the weakest third quarter in the council's data. SPDR Gold Shares (GLD) is down 7.5% this year, in line with the metal.
5. Geopolitics: a premium in oil more than in gold. The U.S.-Iran standoff is unresolved, and attacks on shipping around the Strait of Hormuz hit 37 vessels in October, the most since the conflict began. Oil is rebounding today, with WTI crude up 2.5% to $88.20. For gold, that cuts both ways. Conflict supports safe-haven demand, but higher oil feeds inflation and the case for more Fed hikes. Since September the second effect has mattered more.
The gold/silver ratio
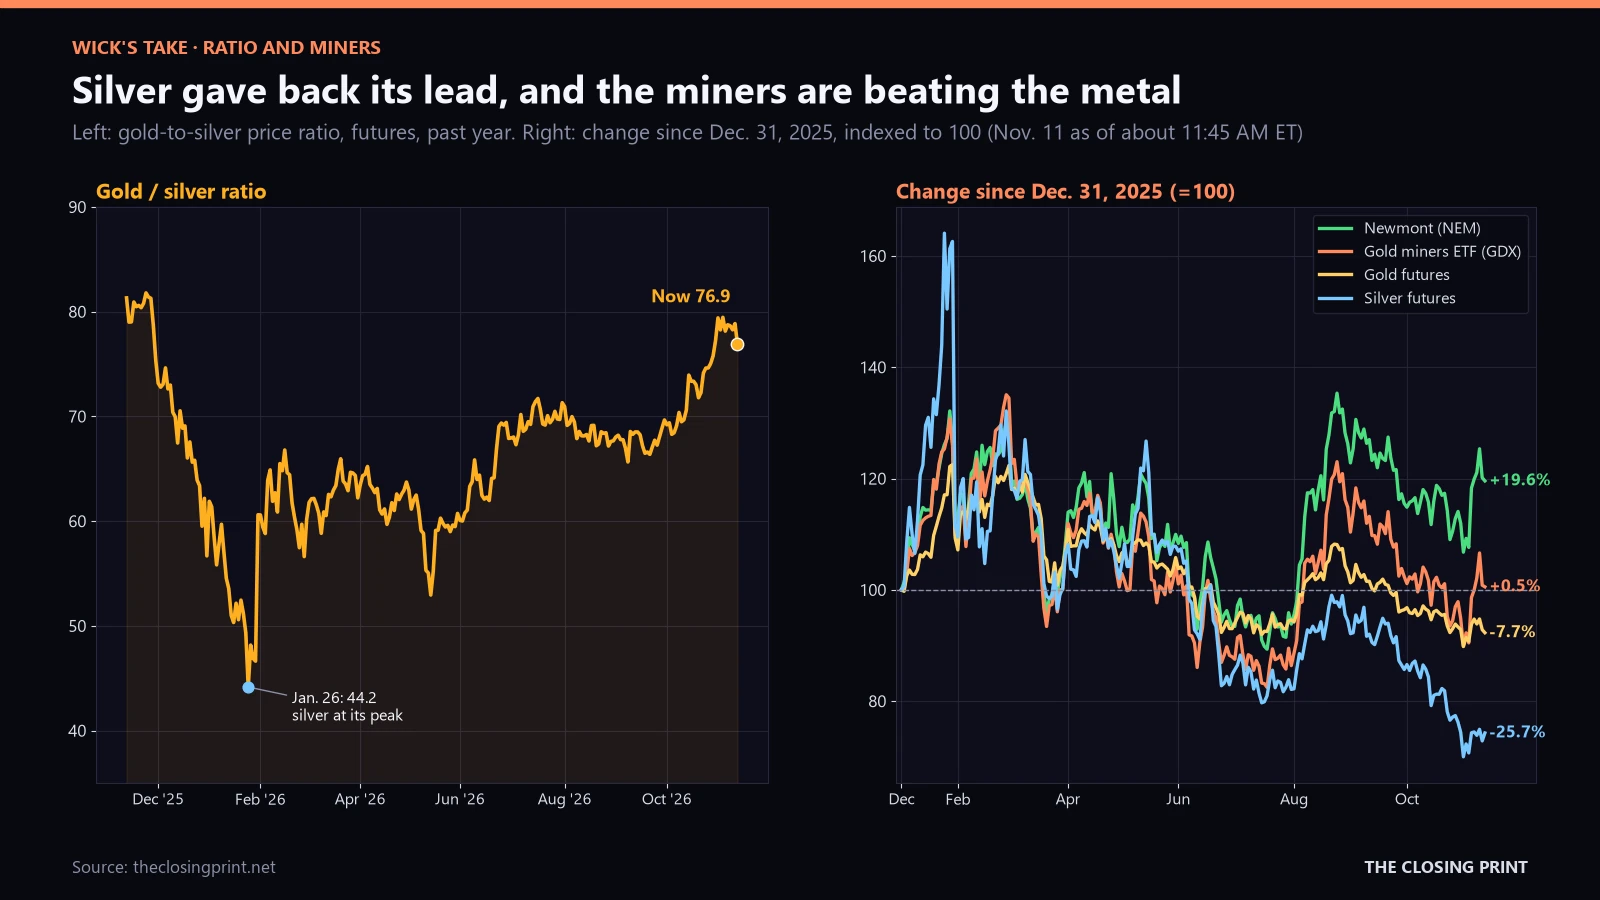
One ounce of gold buys about 76.9 ounces of silver today, using futures. The ratio fell to 44.2 on Jan. 26, when silver peaked, and climbed back to 79.5 on Nov. 3. It was 69.7 when we wrote on Oct. 12. A rising ratio means silver is lagging, and silver has lagged because about 60% of its demand is industrial and it trades like a leveraged, more cyclical version of gold. At 77 the ratio is high by recent standards but below the 81.8 it reached a year ago. We would wait for it to move above 80 before buying silver in place of gold, and we would want a sign that the Fed is close to done first.
Miners vs. the metal
This is where the sector is working. Gold futures are down 7.7% this year, but the VanEck Gold Miners ETF (GDX) is up 0.5% at $86.24 and NEM is up 19.6% at $119.40. Since the Oct. 30 low, GDX has gained 11.9% while gold is up 2.8%. NEM's price relative to GLD hit a one-year high on Monday. Royalty and streaming names have held up too: Wheaton Precious Metals (WPM) is up 16.5% this year and Agnico Eagle Mines (AEM) is up 11.2%.
The reason is margins. NEM's third quarter showed an average realized gold price of $4,317, all-in sustaining costs (AISC, the full cost to keep mines running) of $1,454 an ounce, $1.9 billion of free cash flow and a $3.2 billion net cash position. It bought back $1.6 billion of stock since its July report and has cut its share count about 10% since February 2024. Even at $4,000 gold and the $1,900 AISC NEM guides for the fourth quarter, it clears about $2,100 an ounce. Its guidance assumes $4,500 gold, and each $100 move changes revenue by about $505 million. So a slide to $3,800 would hurt, but NEM would still be very profitable. The risks are costs, which NEM expects to rise in 2027 with diesel and the Australian dollar, and the fact that miners still fall harder than the metal when gold breaks lower.
What would move gold next
- Fri, Nov. 13, 8:30 AM: October PPI. Another hot producer-price number would push half-point hike odds higher and the dollar with it. A soft one is the easiest way for gold to get back above $4,050 to $4,100.
 .ics

- Wed, Nov. 18, 2:00 PM: FOMC minutes from the Oct. 27–28 meeting, when the Fed held at 3.75%–4.00% and two policymakers wanted to hike. Watch how many others were close to joining them..ics
- Wed, Dec. 9, 2:00 PM: FOMC decision with new projections and the dot plot. A quarter-point hike is priced in. A half point, or dots showing more hikes in 2027, is the bear case for gold..ics
- Early December: the People's Bank of China's November reserve data, and the World Gold Council's November ETF flows. A 25th straight purchase would keep the floor in place.
Wick's take
The Oct. 12 call has held up. The Fed kept surprising in a hawkish direction, gold fell to $4,000, silver and palladium did worse, and the miners did better. The setup now is a contest between a Fed that is about to hike and may hike by more than expected, and central banks that buy more every time the price drops. Over the next month the Fed matters more, because PPI, the minutes and Dec. 9 all land before the next central-bank data. Over the next year we think the official buyers matter more, and we think the 4,275 tonnes now in ETFs reflect investors who own gold as insurance rather than as a trade.
What would change my mind: China skipping a month of purchases, a second straight month of U.S. ETF outflows, or the dollar index breaking well above 103 would make $3,900 a level to sell below, not buy. On the upside, a clear sign that the Dec. 9 hike is the last one would matter more for gold than any geopolitical headline.
Not financial advice. This is Wick's analysis and opinion, for information only. Prices are intraday and will change. The per-ounce margin is our own rough calculation from company guidance. Scenario odds are Wick's estimates, not forecasts of any outcome.